FEA: Case Studies
Product: Transition Piece
Technical Information: 3D Modeling Software, Parametric Technologies Modeler, Finite Element Analysis Software, COSMOS
Case Study Information
This item was modeled to the specifications included in drawing 6819001-159020. It uses a standard flange at the top as specified. It has been modified to include the extra length of pipe and to eliminate two flanges. The rectangular flange is fabricated of 1.25 x 5 inch stock and is made of A36 steel. The whole transition and pipe is fabricated of 3/8” thick A516 Grade 70 steel and this was expressed in the model. The model has a temperature condition of 105° C/221°F.
Two cases were modeled in which all references to pressure, PSI, refers to PSIG (PSI gage). The first was at operating condition when the transition piece experiences 18.7 PSI internal pressure. The second was at full vacuum when the transition piece experiences 15 PSI external pressure. The stress and displacement results are expressed in the following plots.
*Note: All references to pressure, PSI, refers to PSIG (PSI gage)
Illustration of Pressures and Displacements – Transition Piece: Internal Pressure = 18.7 PSI

Stress Plot #1 – Transition Piece: Internal Pressure = 18.7 PSI

This model has an internal pressure of 18.7 PSI on every internal surface. The chart on the left of the model shows the stresses at every point in the model by a color coding system.
Stress Plot #2 – Transition Piece: Internal Pressure = 18.7 PSI

This model has an internal pressure of 18.7 PSI on every internal surface.
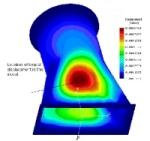
Displacement Plot #1 – Transition Piece: Internal Pressure = 18.7 PSI

This model has an internal pressure of 18.7 PSI on every internal surface. The chart shows the displacement at every point in the model by a color coding system which represents inches of displacement.
Illustration of Pressures and Displacements – Transition Piece: External Pressure = 15 PSI

Stress Plot #1 – Transition Piece: External Pressure = 15 PSI

This model has an external pressure of 15 PSI on every external surface. The chart above shows the stresses at every point in the model by a color coding system.
Stress Plot #2 – Transition Piece: External Pressure = 15 PSI

The chart above shows the stresses at every point in the model by a color coding system. This model has an external pressure of 15 PSI on every external surface.
Displacement Plot #1 – Transition Piece: External Pressure = 15 PSI

The chart above shows the displacement at every point in the model by a color coding system which represents inches of displacement.