Objective
To show the results of temperature and stress analysis in three pipe support shoes intended for cryogenic operation
It is necessary to know the temperature distribution for cryogenic conditions because most steels lose ductility as the temperature decreases from normal operating conditions. That is, the steel becomes more brittle.
Any steel structure will have local areas of high stress. This may be caused by, for example, sharp corners in the design, or by inclusions in the material. At normal temperatures the material in the region of these concentrations will yield, redistributing the load locally. Typically these have no significant effect on the integrity of the structure as a whole. In brittle materials, the material cannot yield, so the only alternative is for it to form a crack. Frequently, once the crack has been formed, it will propagate at the approximate speed of sound until it reaches the end of the part, thus causing a catastrophic failure.
Further complicating the picture is the fact that the tendency for brittle fracture increases with part thickness, and this increase is temperature dependent. Clearly, temperature is a critical variable in selecting steels for cryogenic applications.
The three shoes considered are of the same basic design, but are for three different pipe sizes: 6, 20, and 42 inch. The basic design is shown in Figure 1.
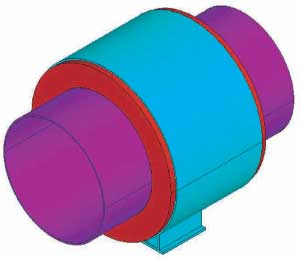
Figure 1: Complete pipe shoe assembly
The shoes have three major components. They are:
1. An outer cover and base of carbon steel, shown in Figure 2A. This has ring stops at either end to engage the insulation to keep it from moving. A point of particular concern was the temperature and stress of the steel on the inner surface of this ring.
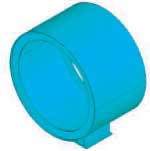
2. A pipe which carries the cryogenic fluid. This has an attached ring of stainless steel, again for engaging the insulation. This is shown in Figure 2B.
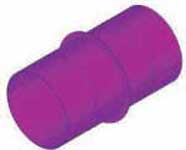
3. The polyurethane foam insulation (PUF) between the first two parts, shown in Figure 2C. As illustrated, the insulation has outer grooves for the shell ring stops, and an inner groove for the pipe ring.
 |
 |
 |
Figure 2A: Shell |
Figure 2B: Pipe and Ring |
Figure 2C: Insulation |
STRESS & THERMAL ANALYSIS
The stress and the thermal analyses are, for the most part, quite similar. The finite element program, Ansys was used for both. There are two main differences between the analyses. Primarily, the material properties are different. Young’s modulus vs. thermal conductivity, for example; the other main difference is in the choice of elements. In this case we used Ansys element 92 for the stress analysis, and thermal element 83. These are both 10 node tetrahedral solid elements. The primary difference is that the thermal element has only one degree of freedom at each node (for temperature), while the stress element has three, one for x, y, and z displacements.
STRESS ANALYSIS
The main concern in the 42 inch pipe shoe case was the inner surface of the outer retaining rings. If the temperature is too low for the stress, the specified steel may not be appropriate according to the code.
The other two cases are very similar to this one and those stress results are given in Appendix A.
Applied loads for all three cases are given in Table1. Note that while the loads were specified in kN, the actual computations were done in inches and pounds, and the results are reported in those units.
Table 1: Applied loads for the stress analysis of the three shoes
|
Pipe Size
|
Axial Load
|
Vertical Load
|
Lateral Load
|
|
42 in
|
600 kN
|
175 kN
|
70 kN
|
|
20 in
|
275 kN
|
65 kN
|
50 kN
|
|
6 in
|
43 kN
|
25 kN
|
10 kN
|
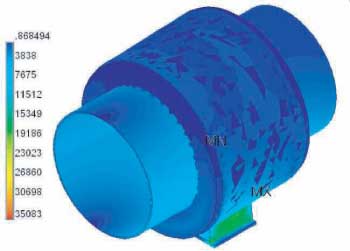
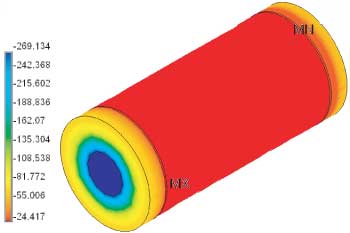
Figure 3: Stresses in the complete assembly for the 42″ pipe shoe
(It is more informative to view the stresses on the individual components)
STRESS ANALYSIS
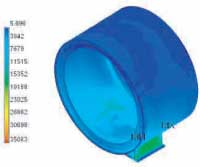
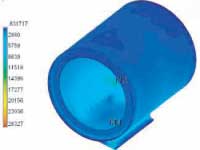
Figure 4 shows an overview of the stresses on the shell and base, and Figure 5 shows a detail of the stresses in the area of maximum stress. The stresses in the shell are generally quite low. However, at the intersection of the base with the cylindrical shell there is a local stress concentration with somewhat higher stresses. This should not be a problem at this location. As we shall see, the temperature here is quite high, as compared to the rest of the shoe.
 |
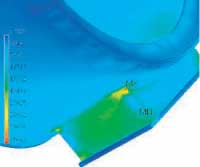 |
Figure 4: Stresses in shell and base |
Figure 5: Detail of stresses in the
|
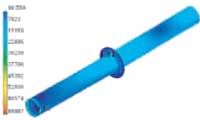
The stresses in the pipe and its ring are shown in Figure 6. The stresses are largest where they would be expected, at the intersection of the two.
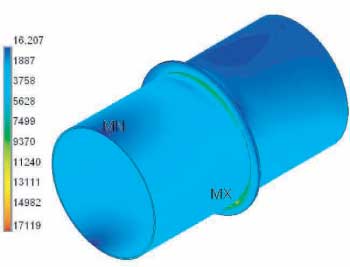
Figure 6: Stresses in the pipe and its ring
STRESS ANALYSIS
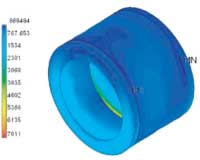
In Figures 7 and 8 we show the stresses in the insulation. Figure 7 is an overview. Figure 8 is a cut away view showing stresses on the inside. The fact that the stress is mostly in the bottom quarter is the result of the significant vertical load.
 |
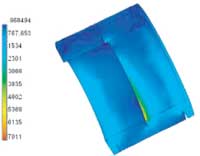 |
Figure 7: Stresses in the insulation |
Figure 8: Section detail of insulation stresses |
THERMAL RESULTS
For all three shoes, the thermal conditions were the same. The inner surface of the pipe was -270°F. The ambient air temperature was -20°F, with a wind velocity of 78.74 in/sec (2 m/sec). Based on this wind speed, and the diameter of the outside shield, we computed a film heat transfer coefficient. The values for the three cases are shown in Table 2.
Table 2: File heat transfer coefficients used in the study
|
Pipe Size
|
Coefficient
|
|
42 in
|
0.008281 BTU/ in2 hr
|
|
20 in
|
0.009651 BTU/ in2 hr
|
|
6 in
|
0.01190 BTU/ in2 hr
|
The values of thermal conductivities used are in Table 3. Note that for the 32 lb PUF case the coefficient is linear with temperature. For the 20 Lb PUF we had only one data point, so we were unable to use a temperature dependent relation.
Table 3: Thermal conductivities for materials used in the study
|
Material
|
Conductivities in BTU /hr in oF
|
|
Carbon Steel
|
2.645
|
|
Stainless Steel
|
0.7846
|
|
32 Lb PUF
|
.0.003007-0.000003627*T
|
TEMPERATURE DISTRIBUTION
In Figure 9 we show the temperature for the complete assembly. As expected, the temperature on the pipe is the specified temperature, and the temperature on the base is slightly lower than the ambient.
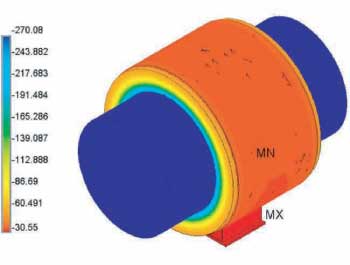
Figure 9: Complete assembly (°F)
Again, it is helpful to look at the individual parts. Figure 10 shows the temperature on the shell and base. The coldest temperature is greater than -40°F, and thus much higher than the temperature that would cause concern.
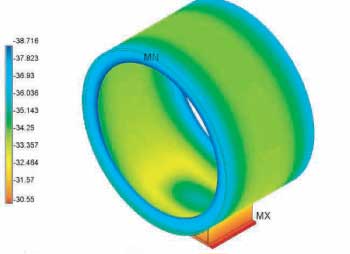
Figure 10: Shell-base assembly (°F)
TEMPERATURE DISTRIBUTION
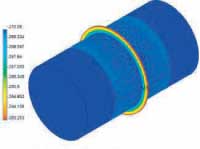
In Figures 11 and 12 we show the temperature distributions on the other two parts. There is nothing particular to note concerning these plots. (Temperatures are °F)
 |
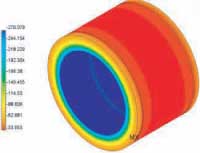 |
Figure 11: Ring and Pipe |
Figure 12: Insulation |
Figure 13 shows the interface between the steel and the insulation. As expected, the temperature in both the inner and outer rings is little affected by the temperature in the surrounding insulation, and is nearly the same as if there were no insulation present.
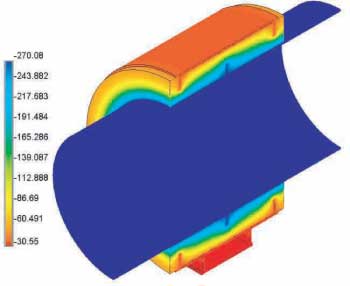
Figure 13: Section view showing interface between the steel and insulation
The report includes both the temperature and the stress at each point of the shoe assembly. This should be adequate for a proper selection of steels for the design.
APPENDIX A
In this Appendix we show the results of the stress analyses of the 20 and 6 in. pipe cases. There is little to add to what has been said about the 42 in. case.
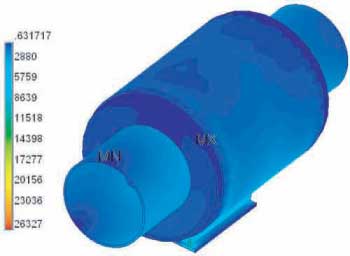
Figure A1: Stresses in 20 inch assembly
 |
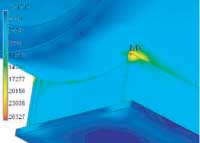 |
Figure A2: Stresses in shell-base part |
Figure A3: Detail of maximum stress |
 |
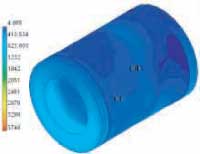 |
Figure A4: Stresses in ring pipe |
Figure A5: Stresses in insulation |
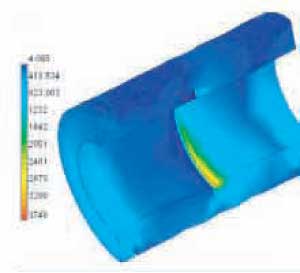
Figure A6: Cut away view of insulation stresses
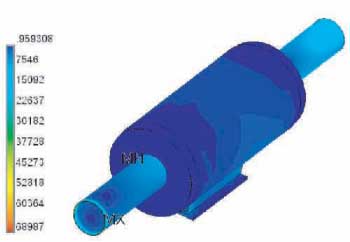
Figure A7: Overall stresses on 6 inch assembly
 |
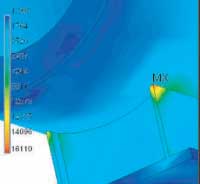 |
Figure A8: Shell-Base stresses, 6 inch case |
Figure A9: Detail at maximum stress |
 |
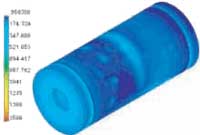 |
Figure A10: Stresses in pipe and ring |
Figure A11: Stresses in 6 inch insulation |
 |
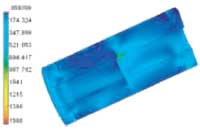 |
Figure A13: Detail of ring |
Figure A12: Stresses on insulation section |
At the left, we show a expanded view of the ring – pipe intersection. The high stresses shown in Figure A10 are very local, and only near the pipe end. This is where the loads were applied. The total load is correct, and, as can be seen, stresses near the intersection are more moderate.
APPENDIX B: Temperature Distribution
Note: Temperatures are degrees °F
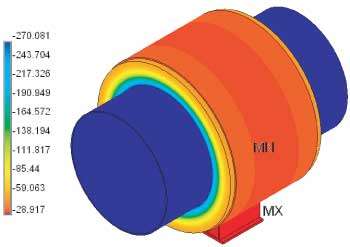
Figure B1: Complete assembly for 20 inch pipe shoe
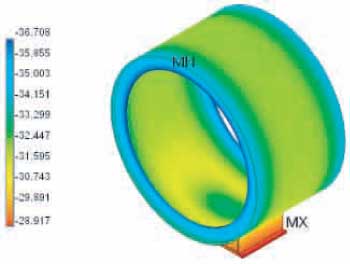
Figure B2: Shell-base assembly for 20 inch pipe shoe
Figure B3: Pipe-ring assembly for 20 inch pipe shoe
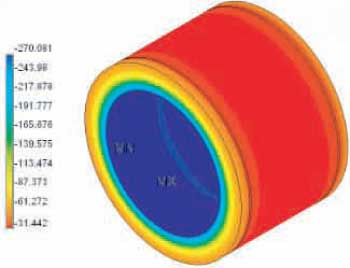
Figure B4: Insulation block for 20 inch pipe shoe
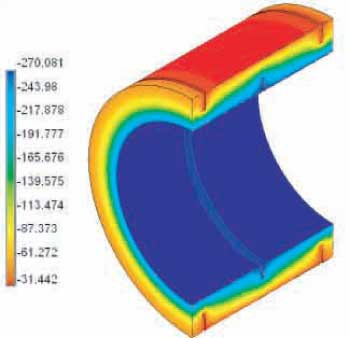
Figure B5: Cut away view of insulation block for 20 inch pipe shoe
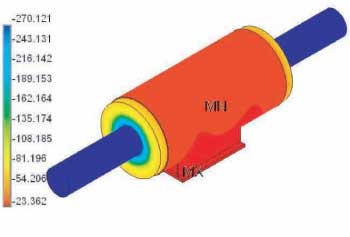
Figure B6: Pipe shoe assembly for 6 inch pipe shoe
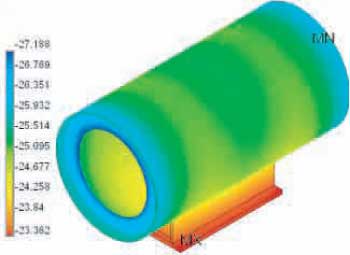
Figure B7: shell-base assembly for 6 inch pipe shoe
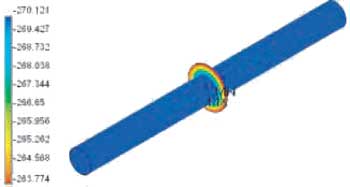
Figure B8: Pipe-ring assembly for 6 inch pipe shoe